
🚨NOT The Bottom Yet: How Low Could Crypto Drop?
Is The Bitcoin (BTC) Dip Only Just Starting?
By reading this newsletter, you acknowledge and accept the terms and conditions outlined in our disclaimer.
📰 NOT The Bottom Yet: How Low Could Crypto Drop?
🐸 MEMEoirs of a Degen!
📢 Biggest Announcements
💭 Banter’s Take
GM Degens,
There are many signs showing us that Bitcoin (BTC) and crypto have not bottomed yet. So we ask: how low can they go, how long could it last, and what might help them bounce later?
Meanwhile, Asia has been selling, and this is happening as the four-year cycle window comes to a close—will this time be different?
What we know is there’s one key thing that likely needs to happen before a bottom shows up…
Let’s dive in!
🌍 Market Catch-Up
Top 100 coins Daily Performance - Banter Bubbles

Source: CoinMarketCap
📰 Question of the Day
NOT The Bottom Yet: How Low Could Crypto Drop?
Let’s get straight to the point. It looks like there’s a lot of evidence that Bitcoin and crypto could drop further. We’ve done some analysis to figure out what’s causing this and how low it might actually go. Take this with a pinch of salt, and remember, as always, none of this is financial advice—you all need to do your own research.
Let’s take a look...
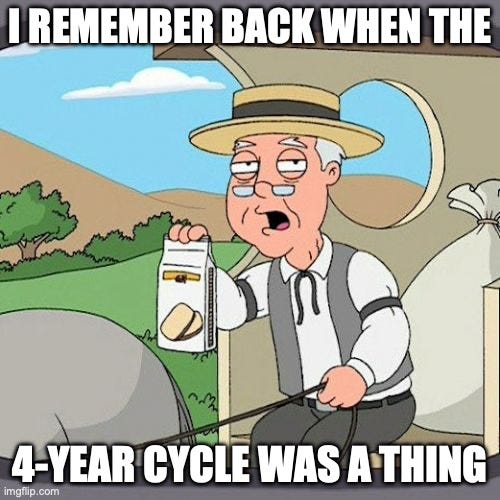
There’s a lot of fear in the market right now, and it may be because we’re about two weeks away from invalidating the four-year cycle theory. And that’s a big one. Many see the four-year cycle as “law”. We’ve talked about this recently—how people who believe the four-year cycle repeats are likely starting to take profits, if they haven’t already. This has caused a tug of war between long-term holders taking profits and institutions slowly accumulating Bitcoin and other crypto.
Meanwhile, it seems a lot of the current dumping is coming from Asia during their trading session. And though institutions are accumulating Bitcoin supply, they seem to be slowing down on crypto in digital asset treasuries (DATs).
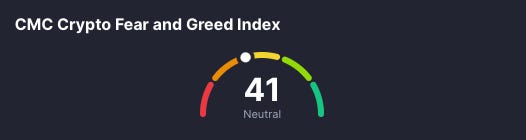
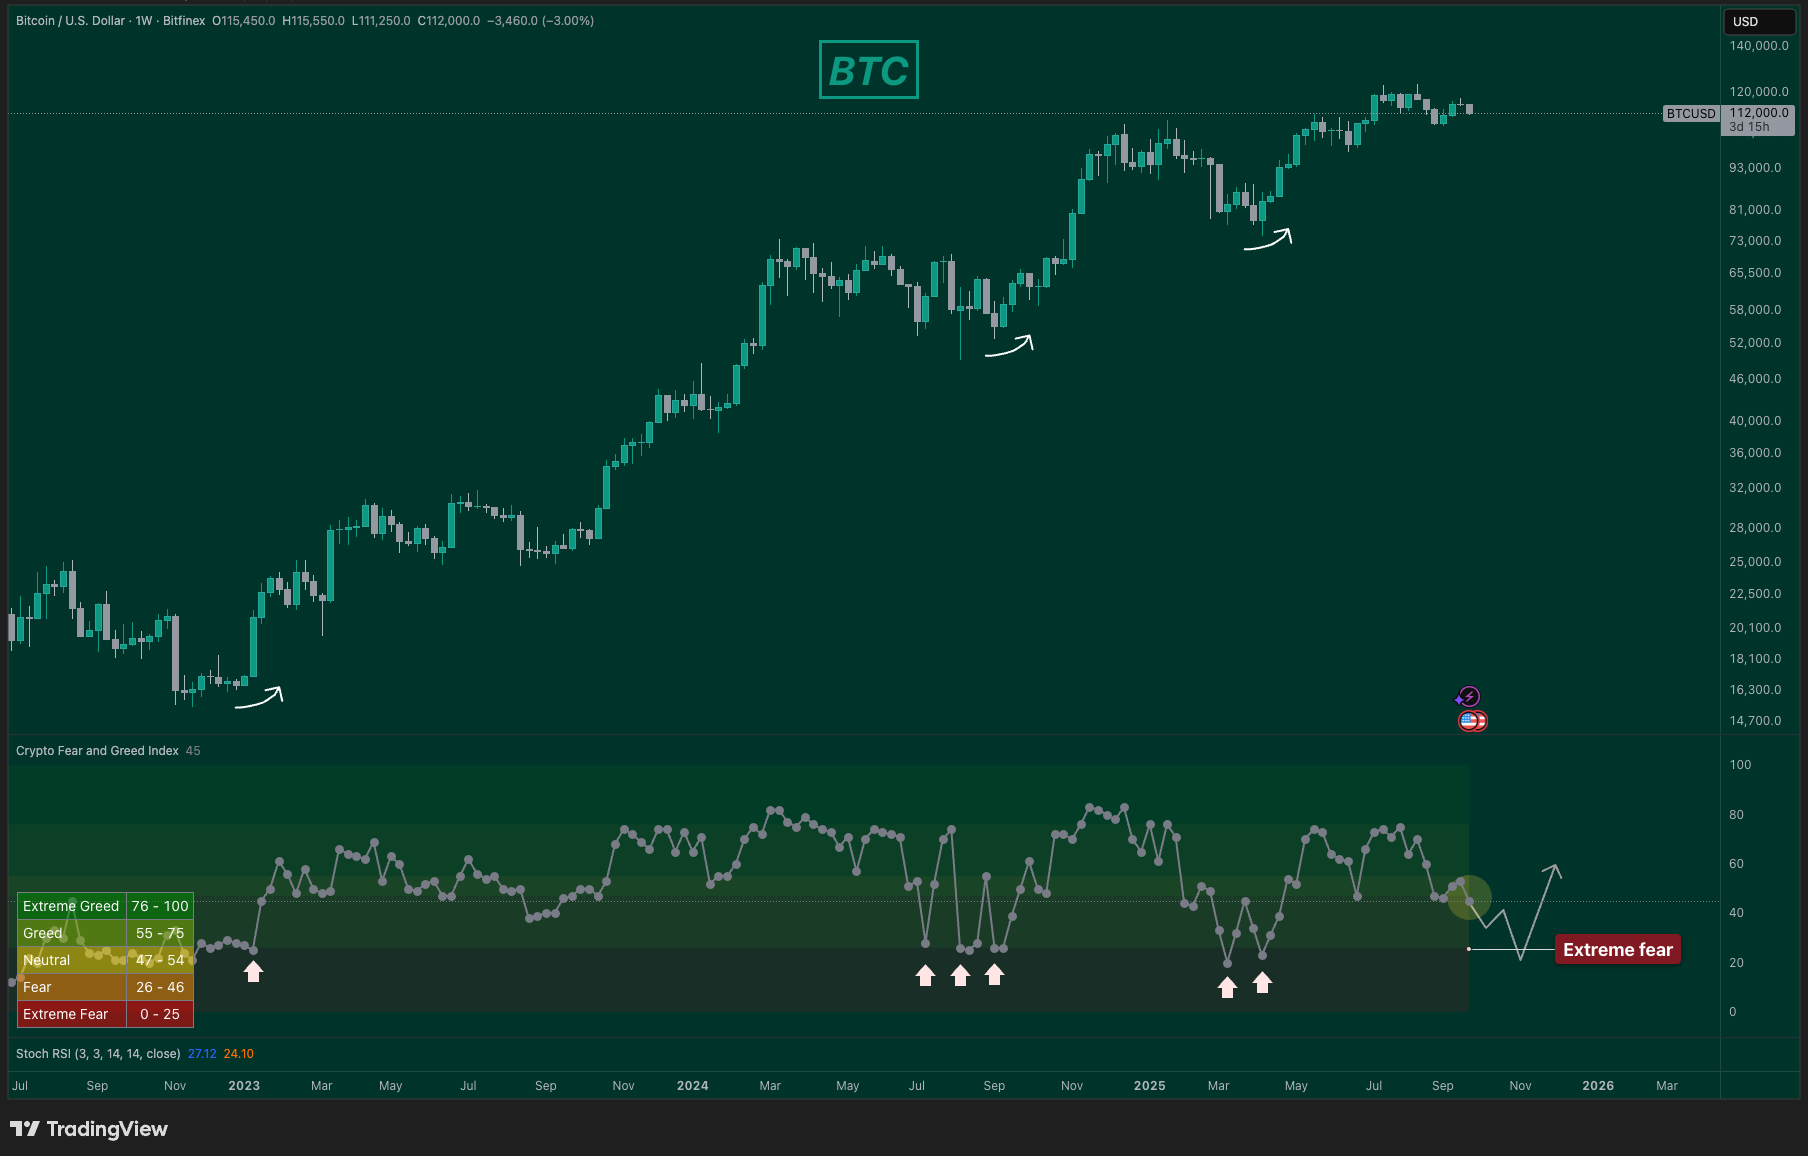
As you see, there are multiple reasons for this dump, and looking at the charts, it seems we could head even lower. But, at the end of the day, it all comes down to this one little thing: the dump is causing fear, but it’s not over until we see Extreme Fear. Sometimes things are simple, and as you can see in the chart below, once we reach Extreme Fear on the Fear & Greed Index, it usually marks a local bottom.
So, lower it probably is, but there’s more…
The RSI heatmap is showing us the same outcome: there’s still more downside before a reset, as the majority of altcoins remain in neutral territory right now.
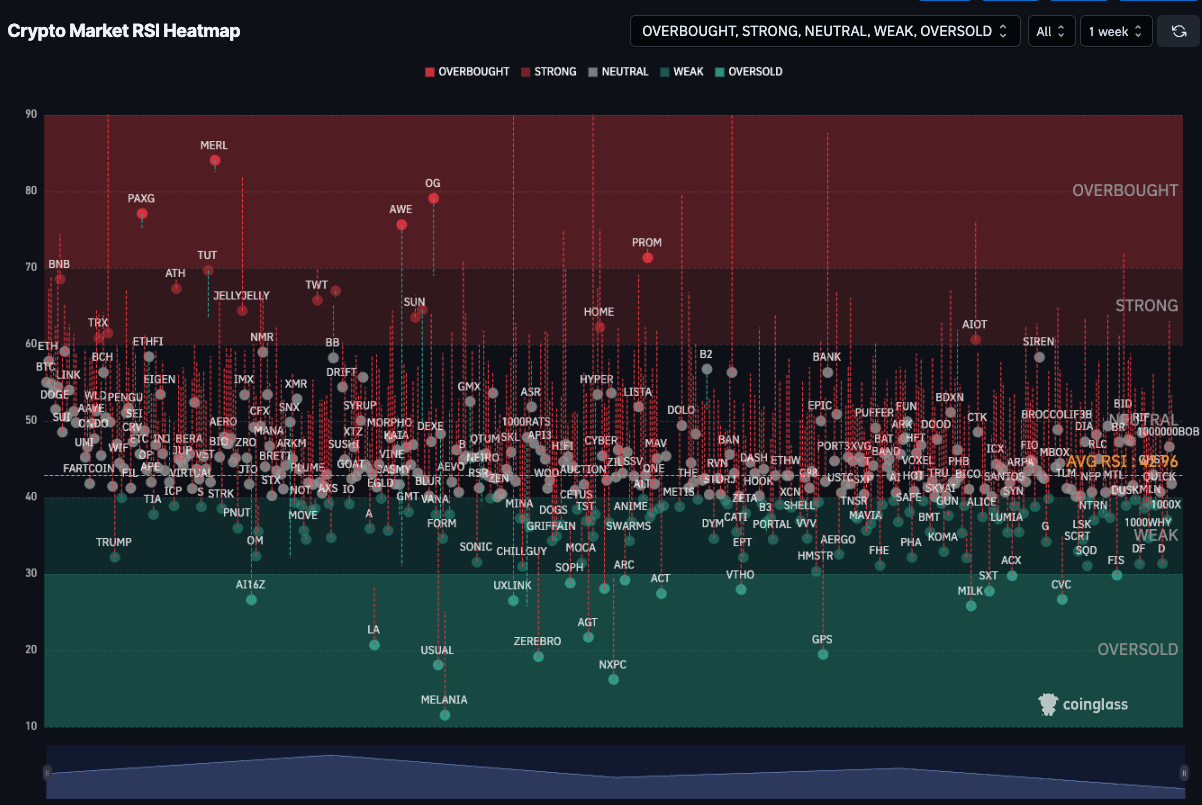
Source: Coinglass
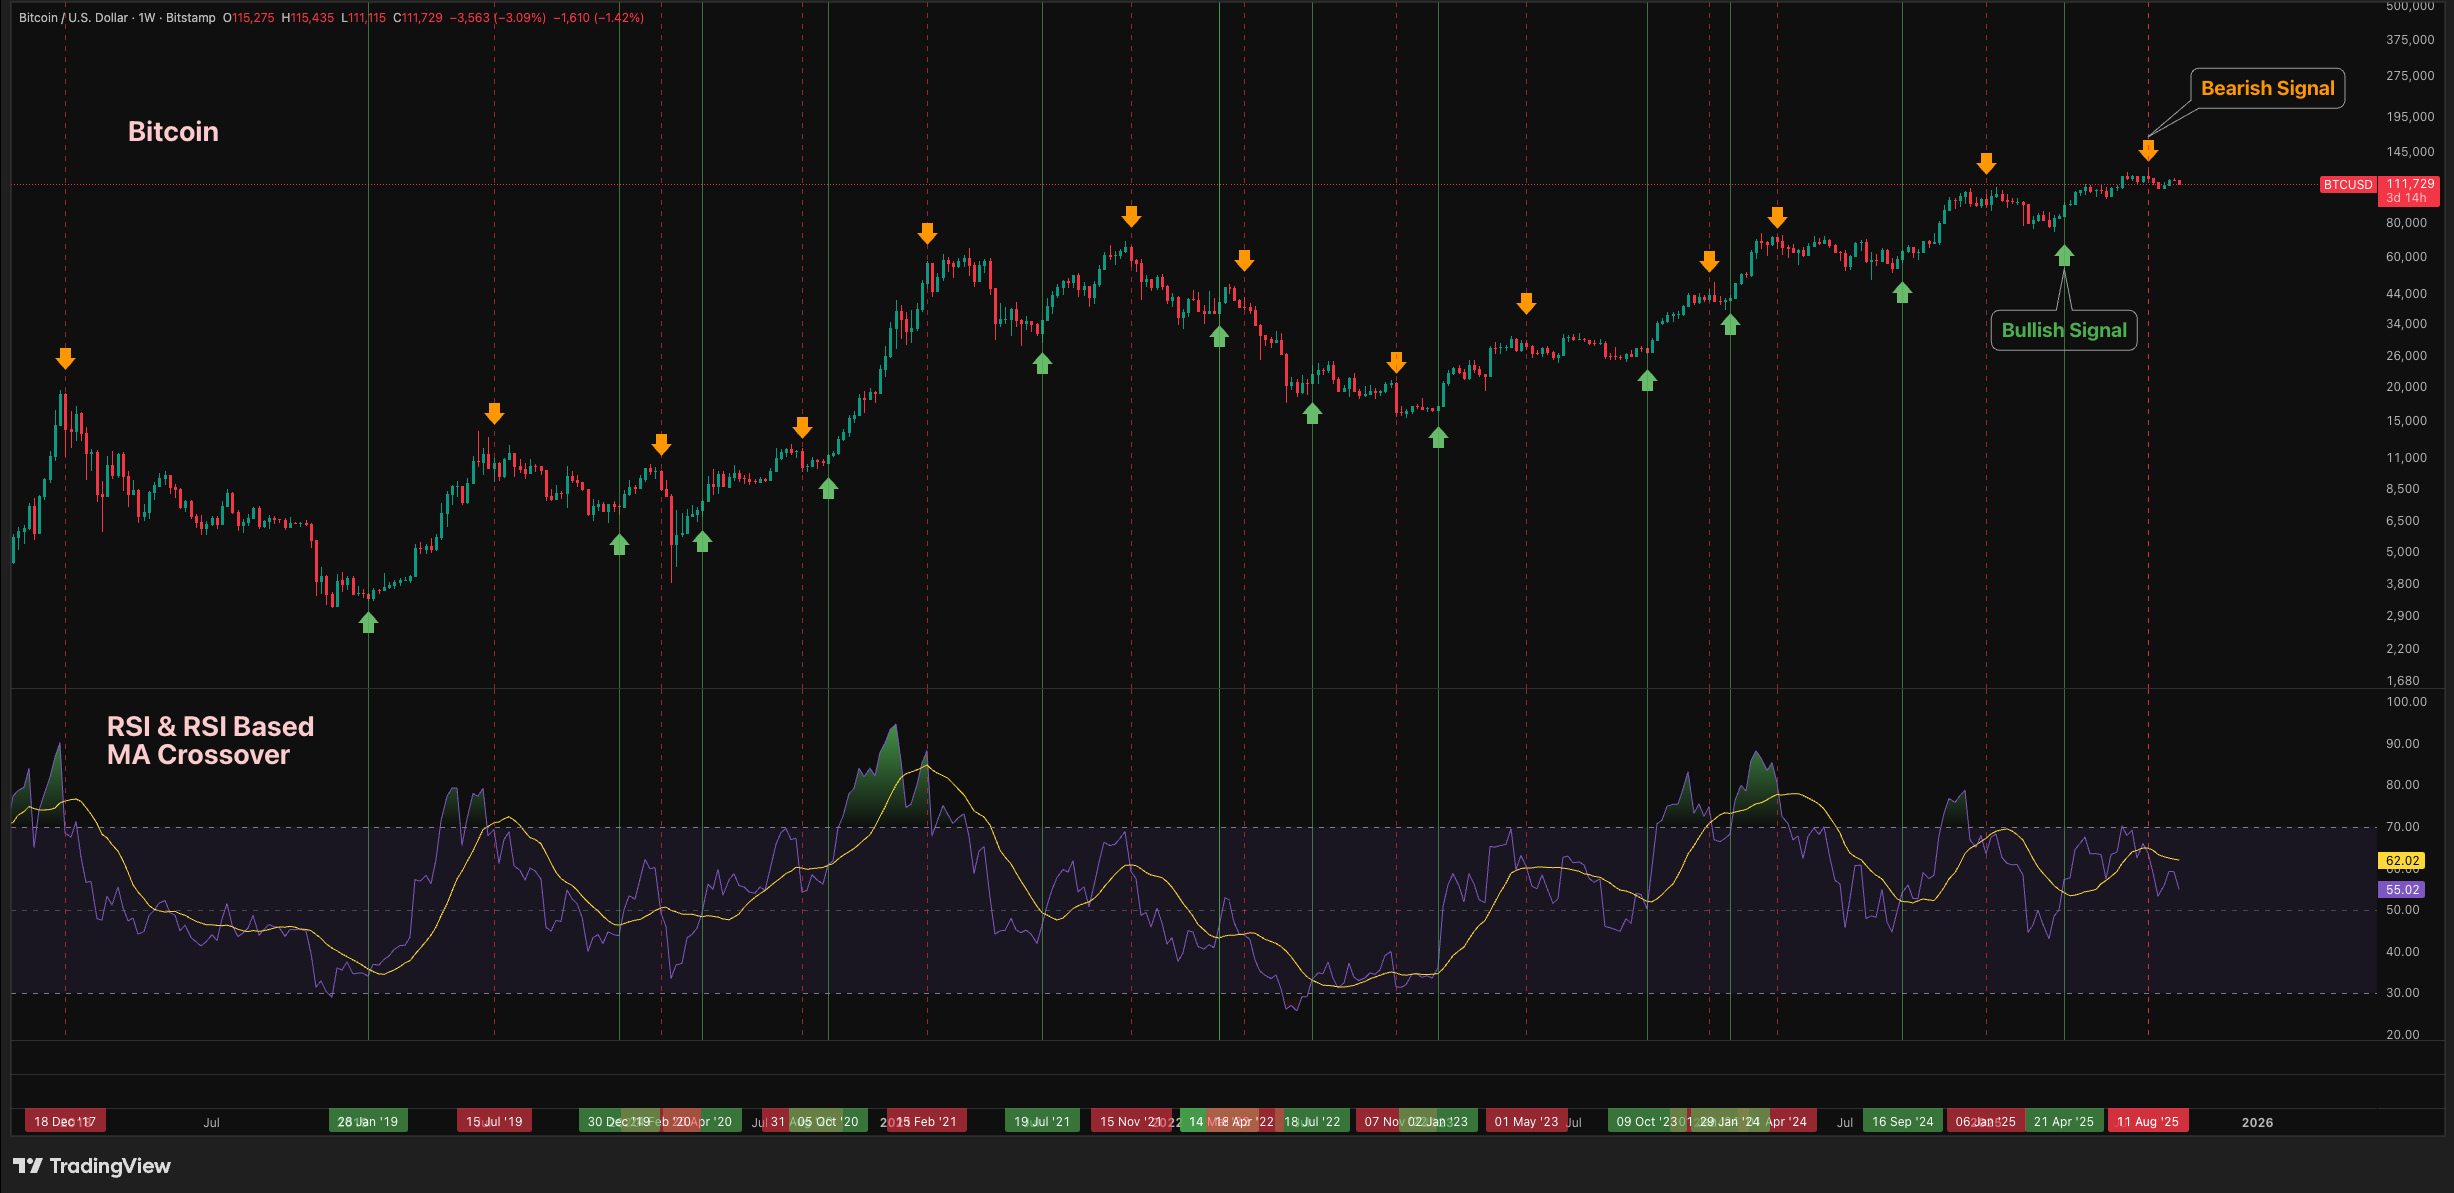
And if you look at the Bitcoin RSI crossover, it doesn’t happen often. We had a bearish crossover on August 11, and so far no bullish signal, which basically tells us to stay patient.
Another signal that risk-on assets, including Bitcoin, could see further downside is the S&P 500, which looks set for a potential correction soon, with valuations historically stretched, seasonal weakness into October, and resistance levels showing similar patterns to past pullbacks.
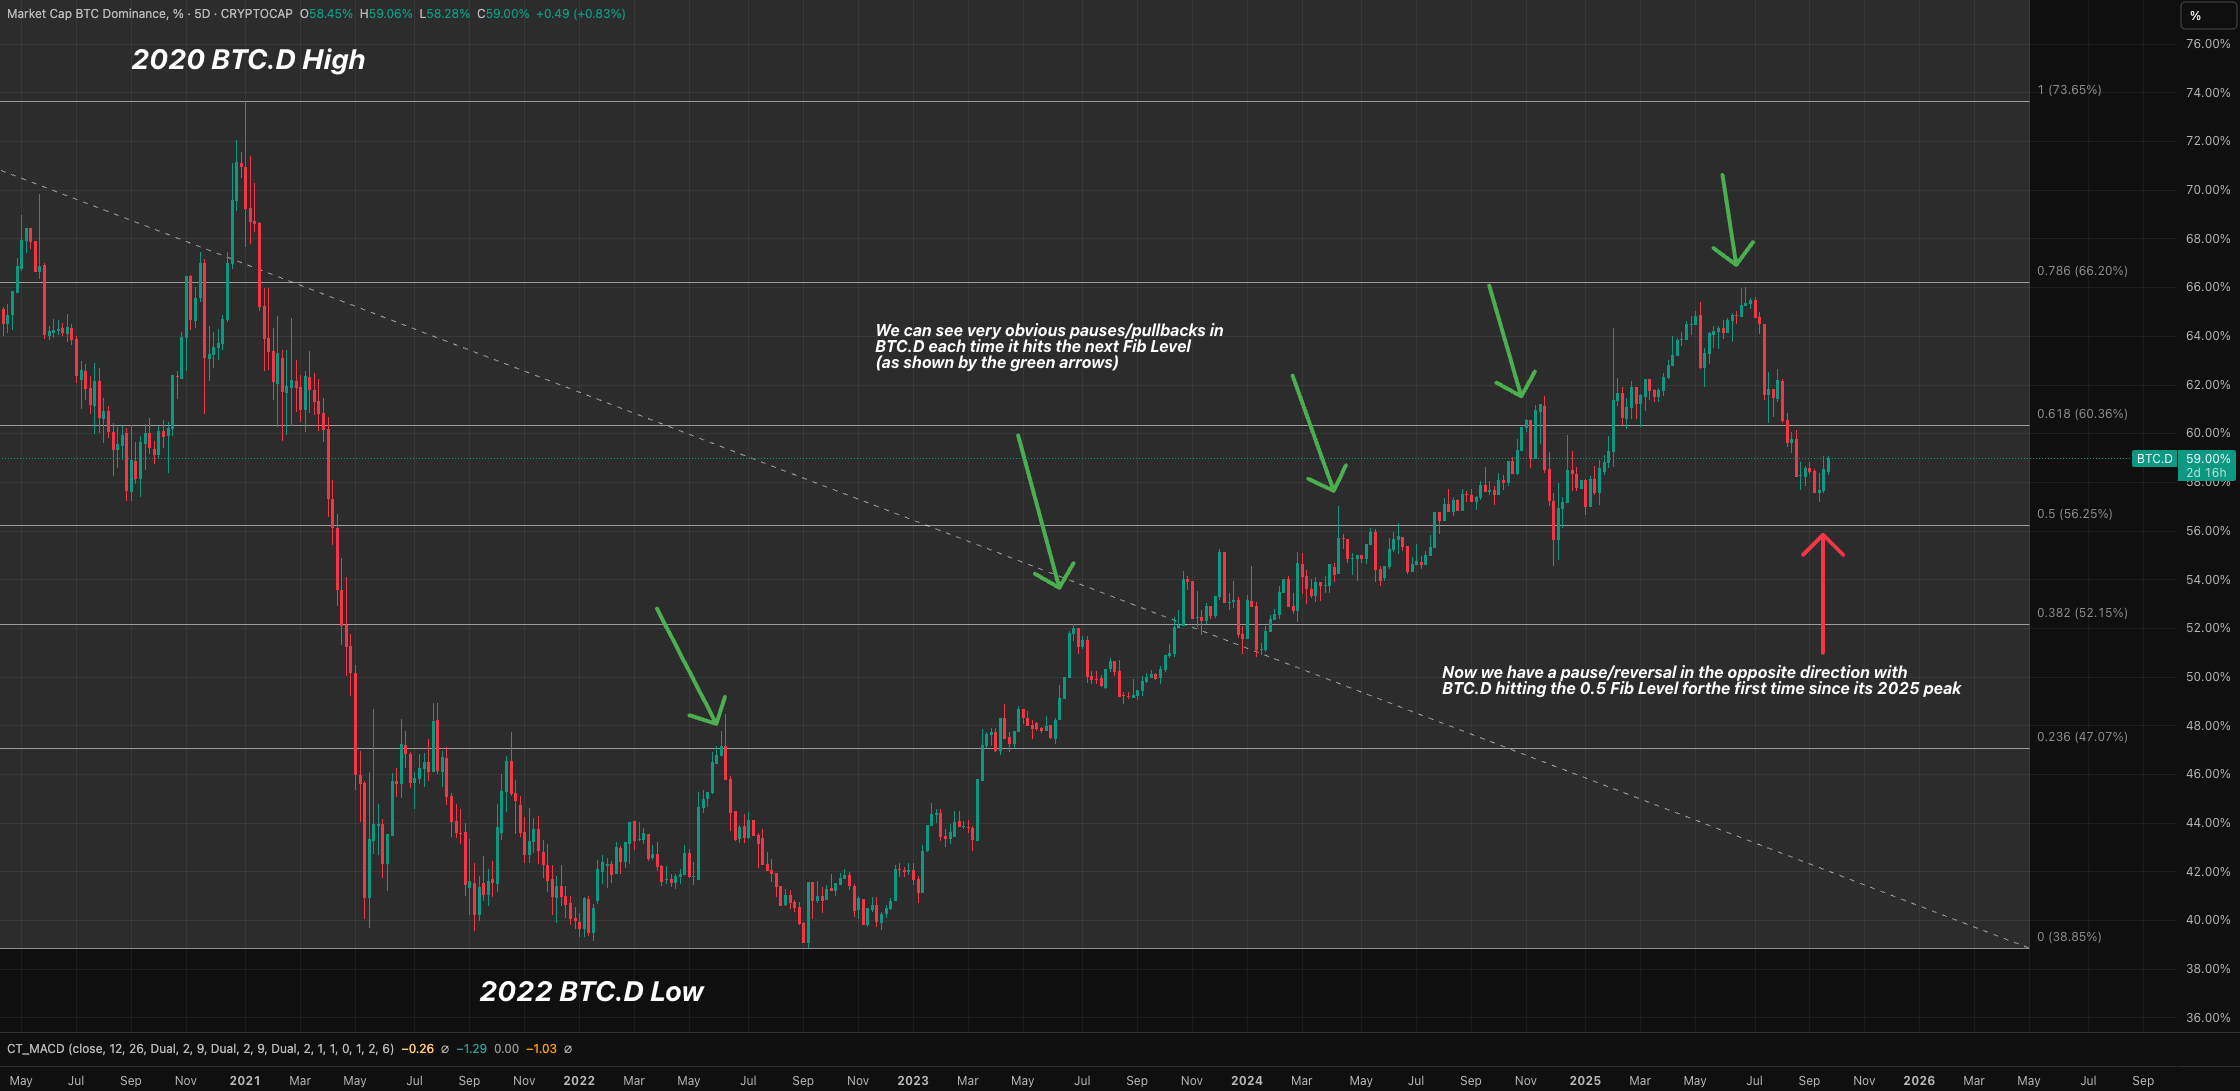
A bad time for risk-on often means altcoins get hit the hardest. And this becomes evidently worse for alts when you consider October is historically one of the best months for Bitcoin dominance (BTC.D). If BTC.D rises, altcoins feel the pain. Right now, Bitcoin dominance is indeed forming a low on its chart. According to our analysis, it could reach up towards 60.35% next.
How Low Can Bitcoin Go?
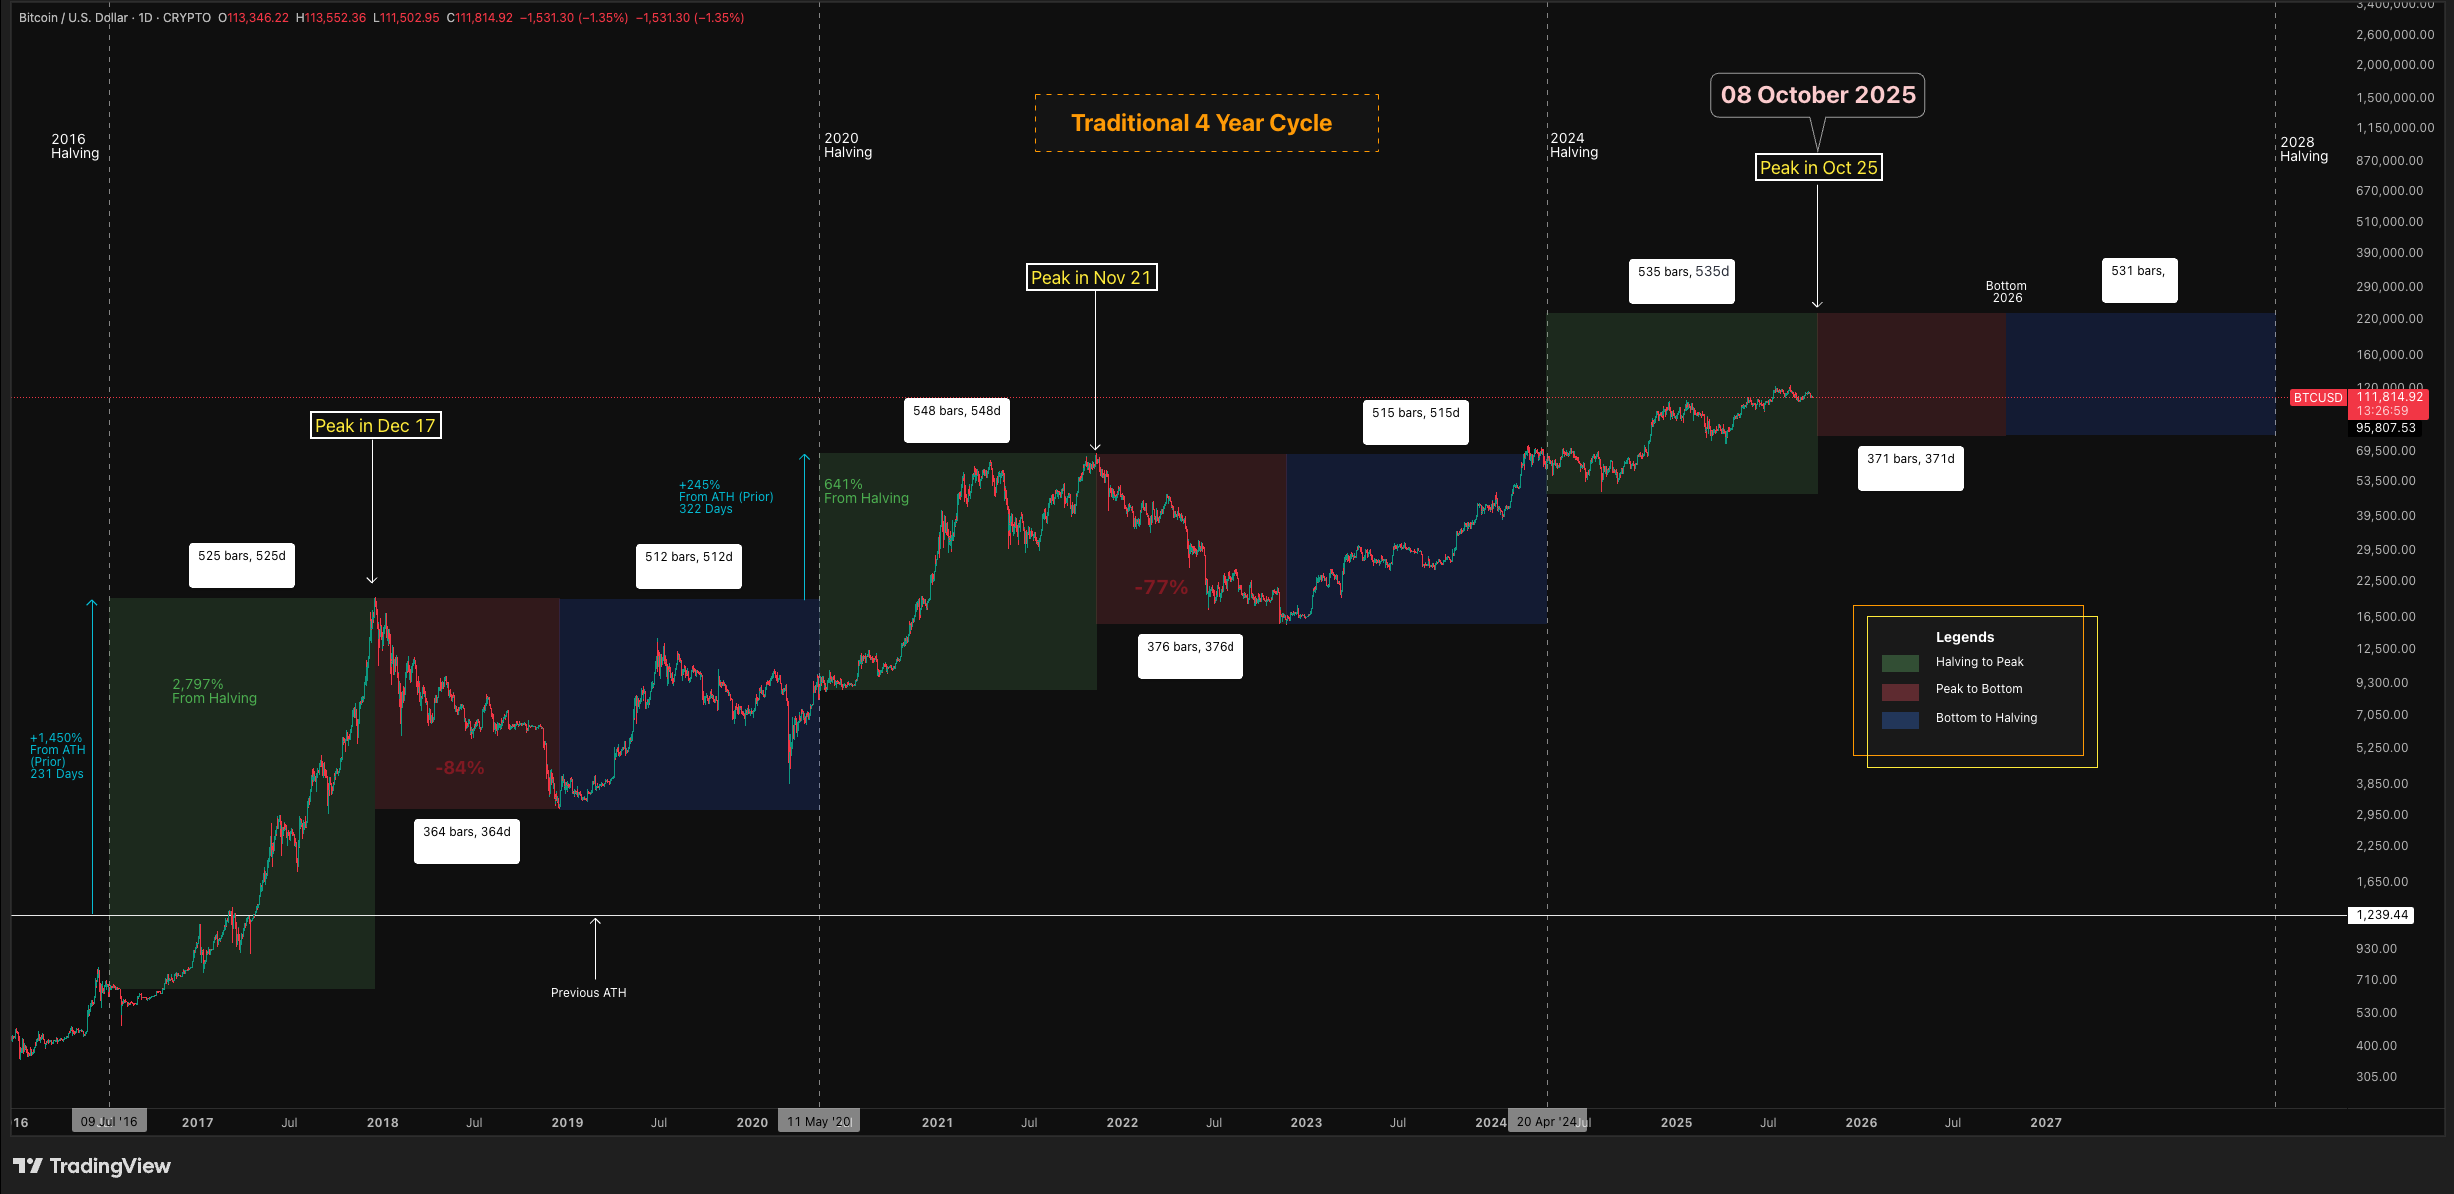
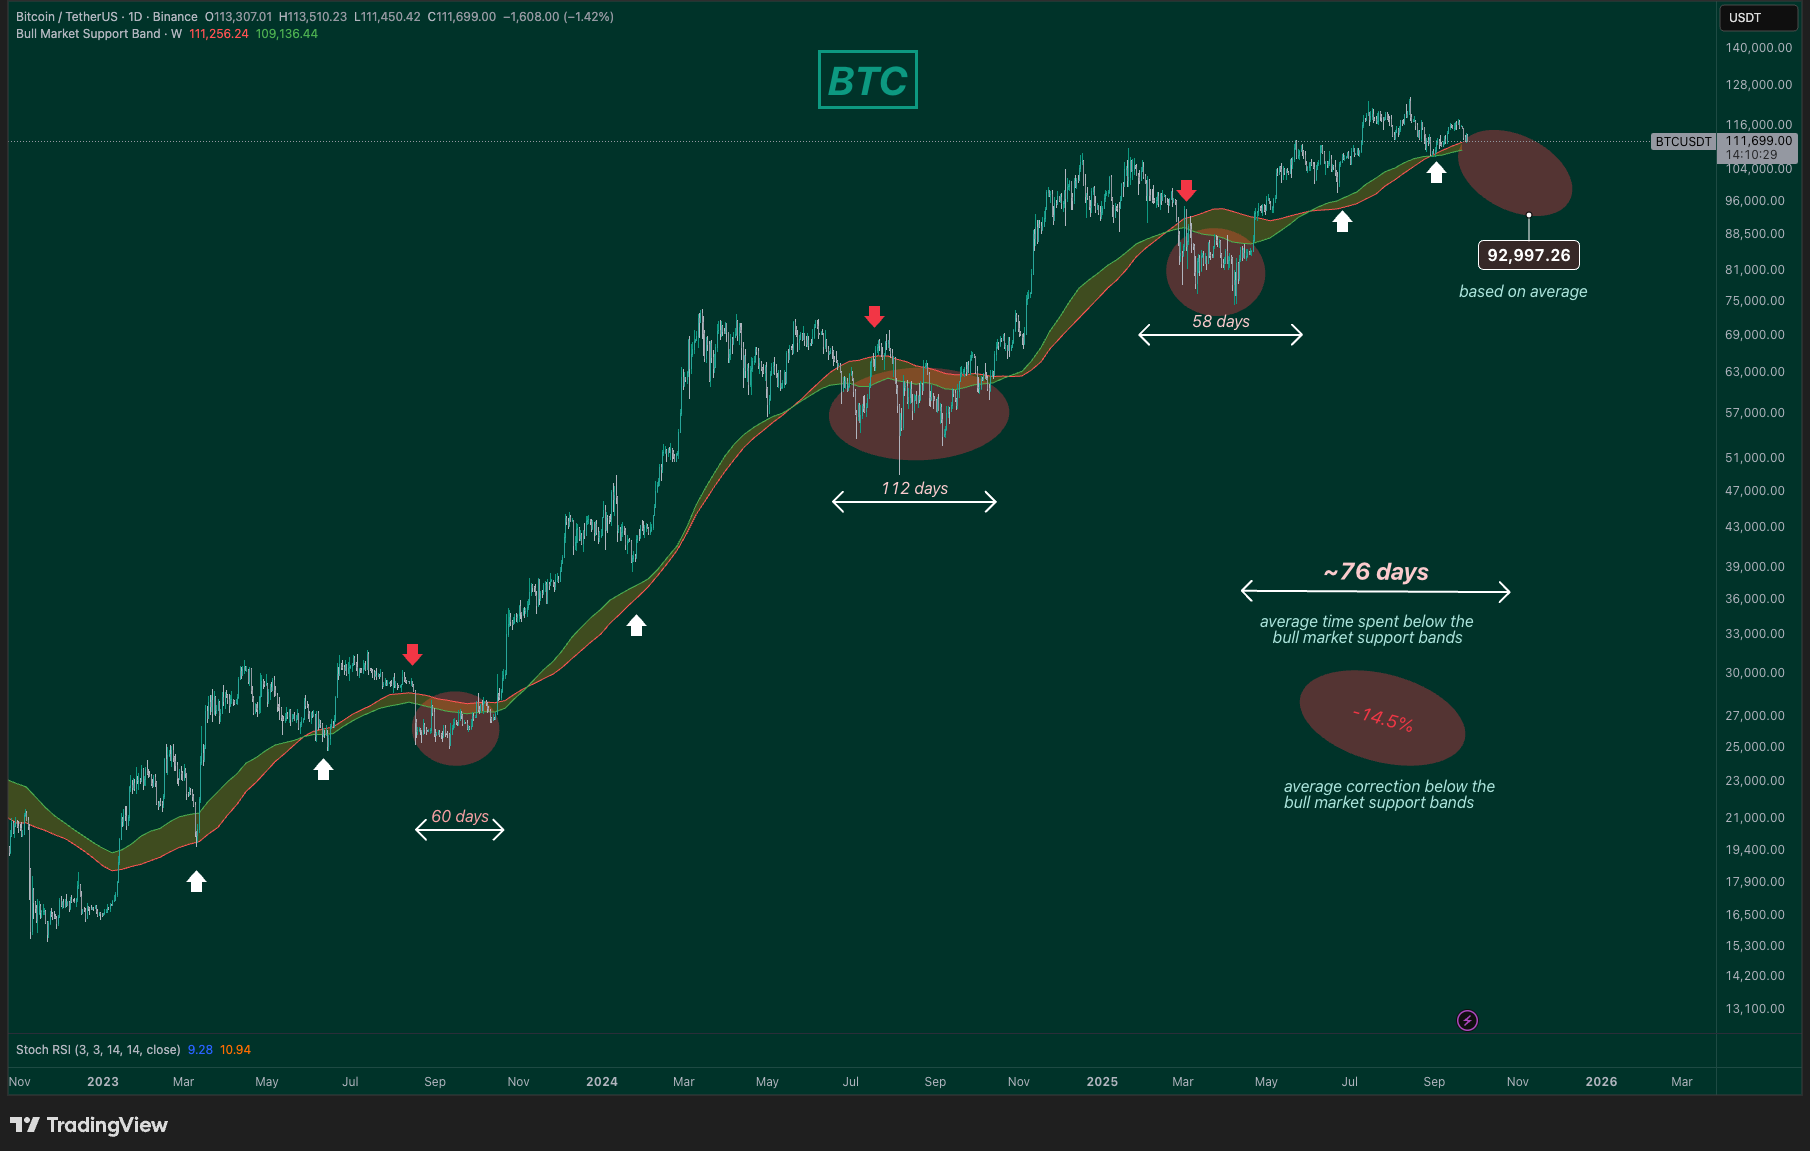
We’re watching a few key levels for potential downside targets. The first is the Bull Market Support Bands. Based on historical data, here’s what we see:
Average time spent below the bull market support bands: ~76 days
Average move below the bull market support bands: -14.5%
If this pattern plays out similarly, the projected target would be around $93K.
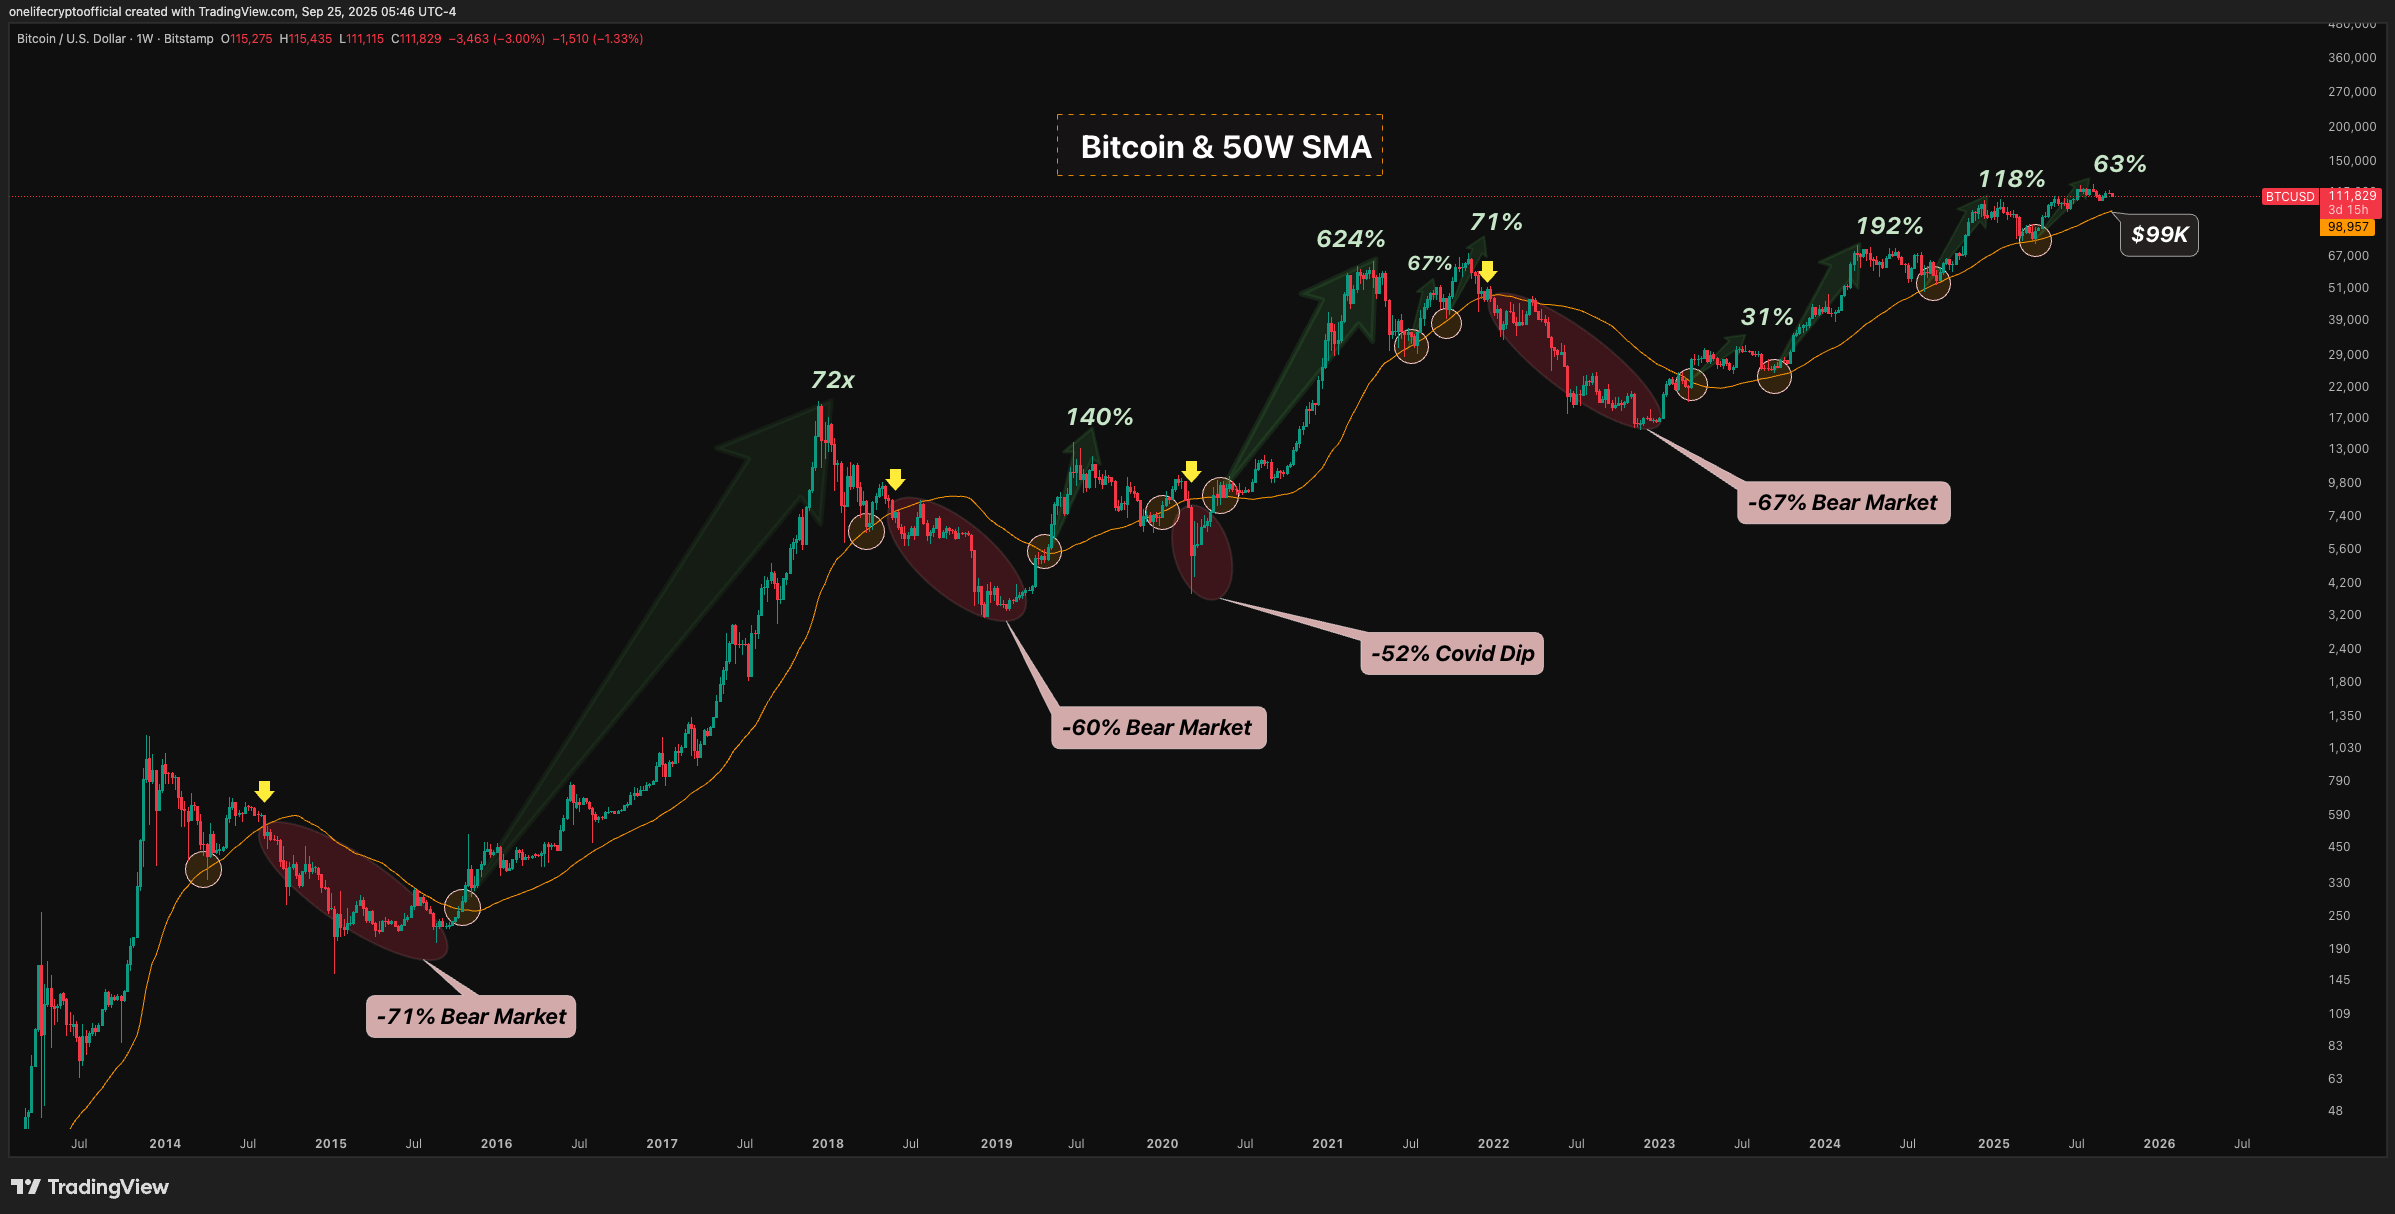
The next level is the 50-week SMA, which has historically supported the bull market.
Current level of the 50W SMA: $99K
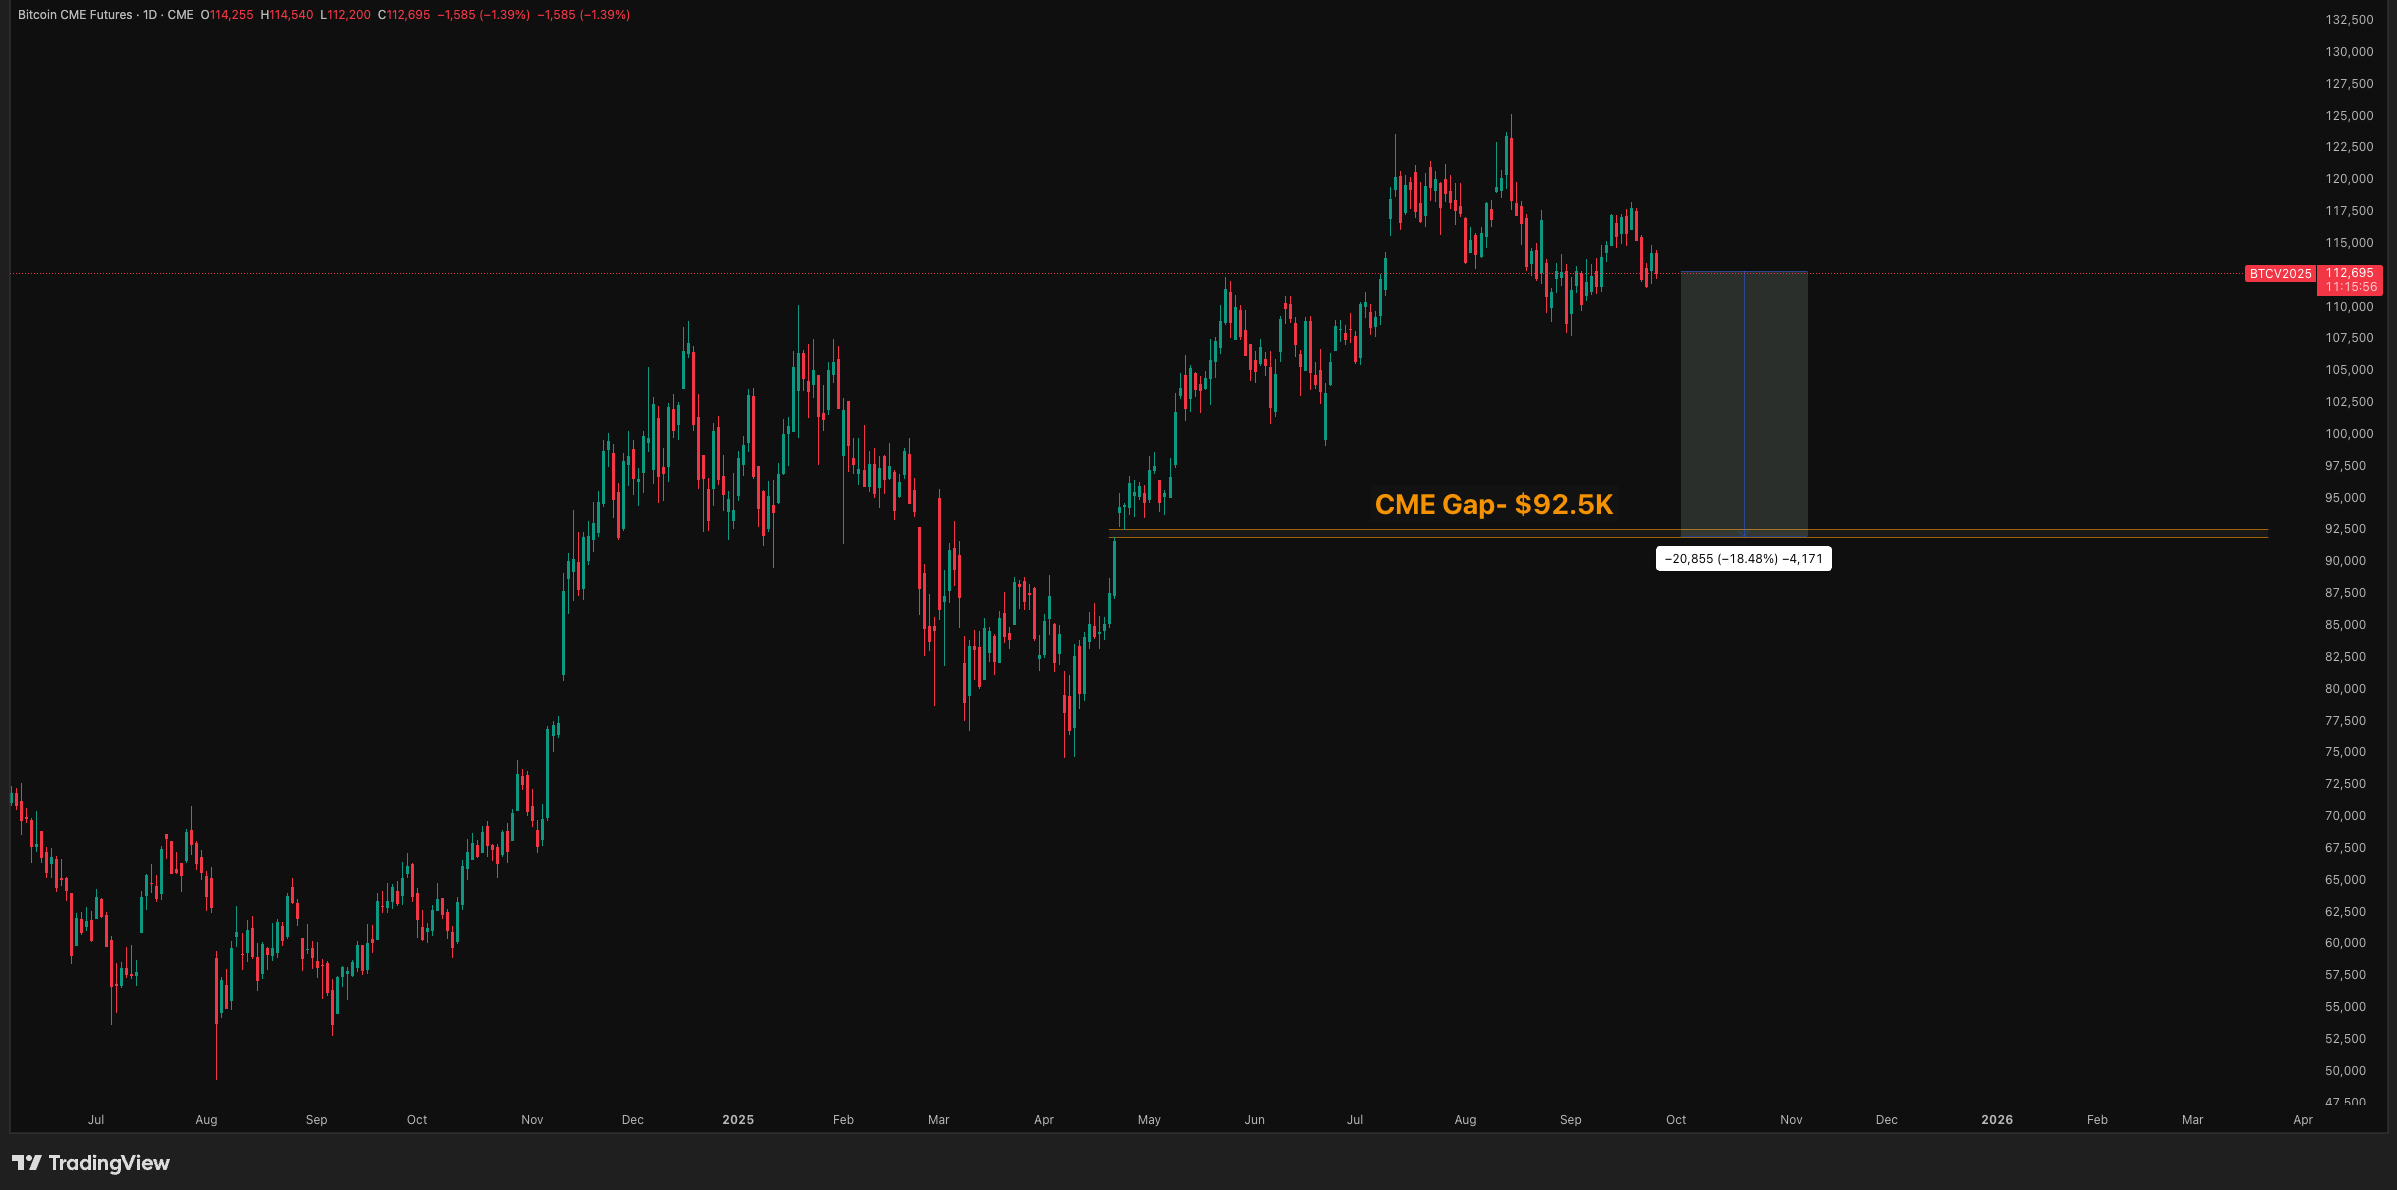
And lastly, the worst of all—the CME gap.
CME gaps often get filled, though it may take months or even years, maybe even during the bear market. It doesn’t have to be filled now, but it’s still worth considering.
The CME gap just below currently sits at $92.5K.
We should also factor in average cycle corrections, which provide additional context for these potential downside targets:
Average correction this cycle: 21%
Implied level from the August top: ~ $98K on BTC
If you like the content, please hit subscribe below.
What Could Pump the Market Back Again?
A few factors could help Bitcoin catch up later, which would likely lift altcoins with it.
First, there’s the M2 global money supply. Remember how we were tracking this a few months ago and noting its correlation (with some lag) to Bitcoin? Raoul Pal also talked about this correlation. He believes part of the de-correlation comes from the Treasury General Account (TGA) getting refilled. To refresh your memory, the TGA is the U.S. Treasury’s operating cash account at the Federal Reserve, which manages government receipts and payments. Pal thinks the TGA refill created a short-term liquidity drain, causing BTC to stall. Now that the account is full, the BTC/M2 correlation could resume soon. Meanwhile, the M2 is printing a new all-time high (ATH).
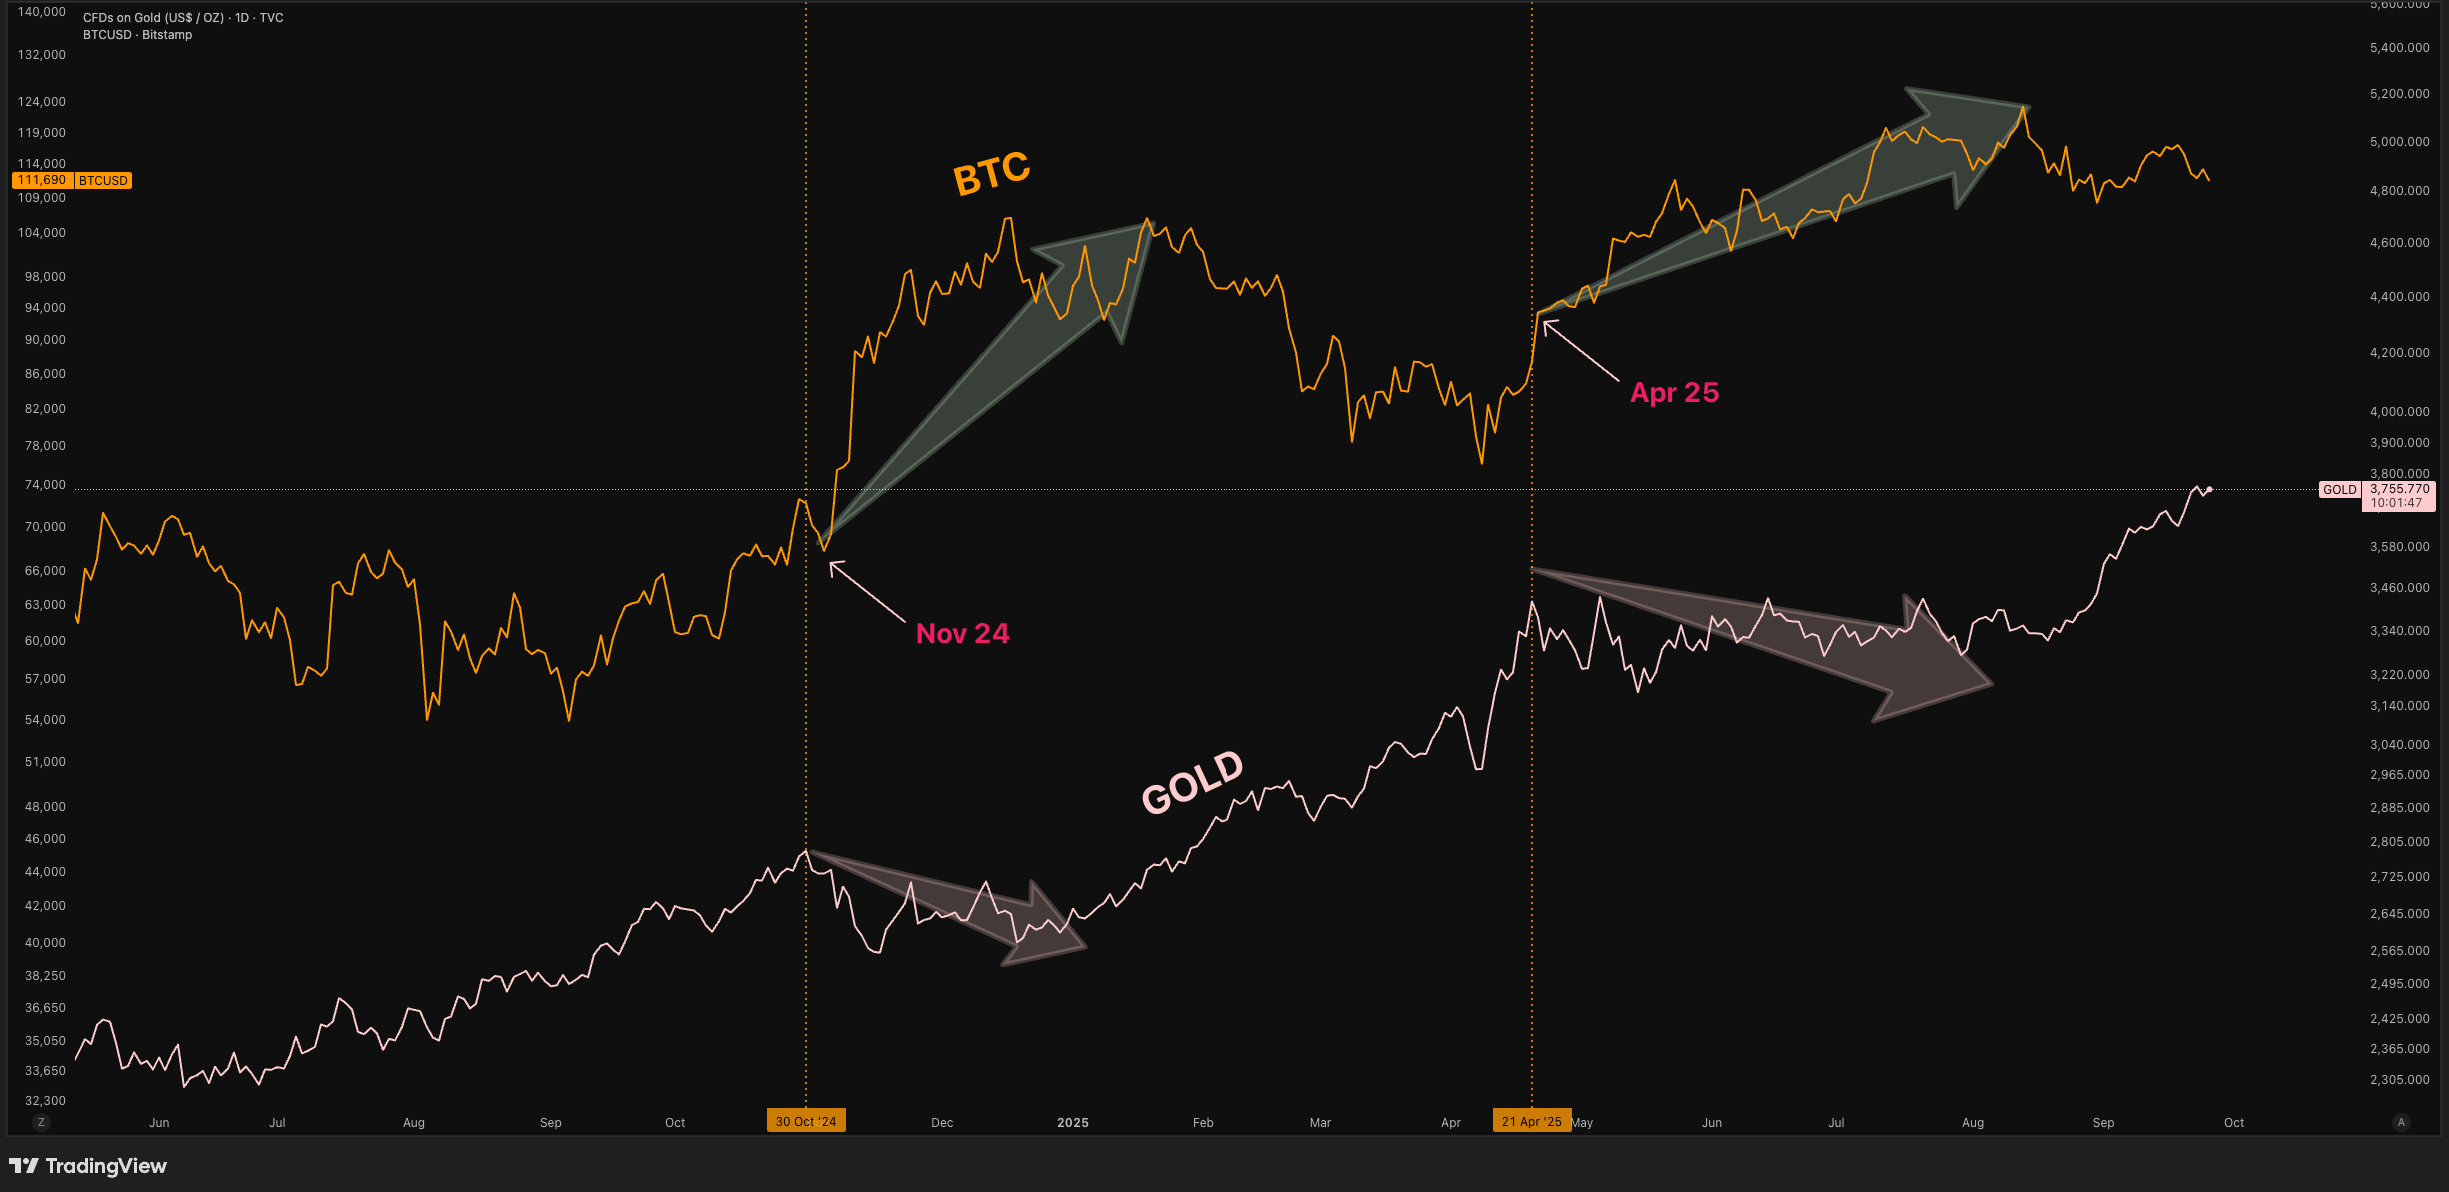
Another recent point we looked at is gold. Usually, gold moves before Bitcoin rallies. Could a pattern like the one below play out soon?
Final Thoughts
The data suggests there could still be more downside ahead—though crypto is known for surprises. Still, based on what we’ve reviewed, clear levels to watch are:
Bull Market Support Bands loss: ~ $93K
50W SMA: ~ $99K
CME gap: $92.5K
Target based on average cycle correction: ~ $98K
These zones are where risk/reward shifts, sentiment flips, and participants start questioning whether the cycle is truly over. We’re unlikely to see this until Fear & Greed reaches extreme lows and altcoins suffer deeper bleed-outs.
The Biggest Bet of This Cycle: 0G Labs

0G is being called the “Solana for AI”—a Layer 1 chain purpose-built for AI, backed by $325M in funding, with 50,000x faster performance than competitors and 300+ partnerships including Alibaba and Optimism. Last cycle, DeFi defined the narrative. This cycle, it’s Decentralized AI—and our new partner, 0G, is already positioning itself as the clear leader.
As costs of centralized AI explode and regulators demand verifiable systems, 0G delivers an all-in-one stack for AI: storage, compute, and execution—at up to 90% cheaper than today’s alternatives. Think Ethereum for DeFi, Solana for dePIN… now 0G for AI.
Why is 0G Labs set up to be the biggest breakout launch of this cycle?
50,000x faster AI performance
First all‑in‑one AI stack (storage + compute + execution + marketplace)
90% cheaper AI training costs
+300 partnerships (Alibaba, Optimism, NTT Docomo)
+$325M in funding from tier-1 VCs
The 0G token is now live!👇
🐸 MEMEoirs of a Degen!
📢 Biggest Announcements
Nine European Banks To Launch MiCA-Compliant Euro Stablecoin By 2026
Plasma (XPL) Goes Live on Spot Markets Today
💭 Banter’s Take
So there you have it. Even though we remain bullish, we can’t ignore the signs pointing toward lower prices for now. The levels we’ve identified are crucial to keep an eye on, and we will. However, there’s a little more to the story—catch today’s episode of Crypto Banter with Ran for more.
See you all tomorrow!
What about all the unlocks for this week, Billions of dollars worth will pout an enormous down pressure on the market